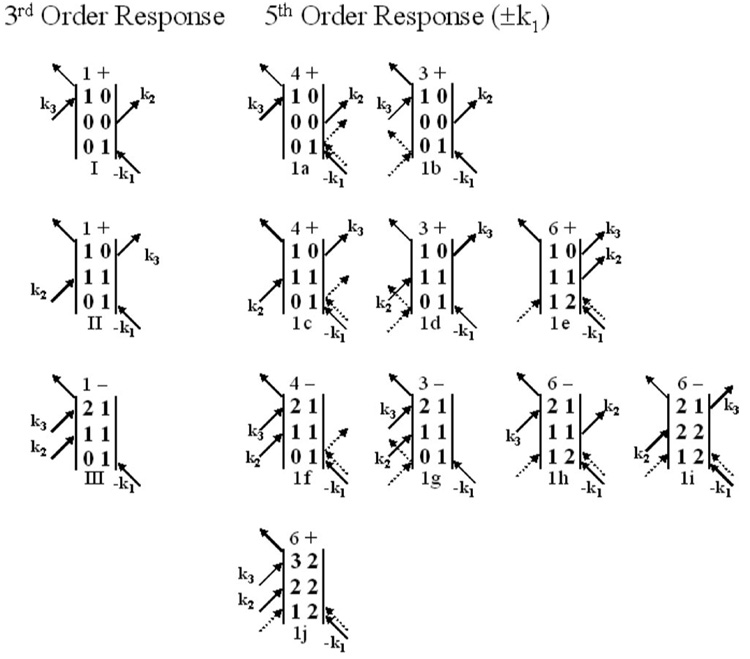
FIG. 4.
Third order diagrams giving rise to the vibrational echo signal and the related fifth order diagrams with the two additional radiation field-matter interactions occurring in pulse 1 (±k1). The coherence periods caused by the extra interactions are omitted, but the population periods are shown explicitly. The two additional interactions are shown as dashed arrows. Diagram 1e causes oscillations in the vibrational echo decays at the 0-1 transition frequency. Diagrams 1h and 1i cause oscillations in the vibrational echo decays at the 1-2 transition frequency. The number of permutations of the incoming fields and the sign of the diagram are shown before each diagram.

