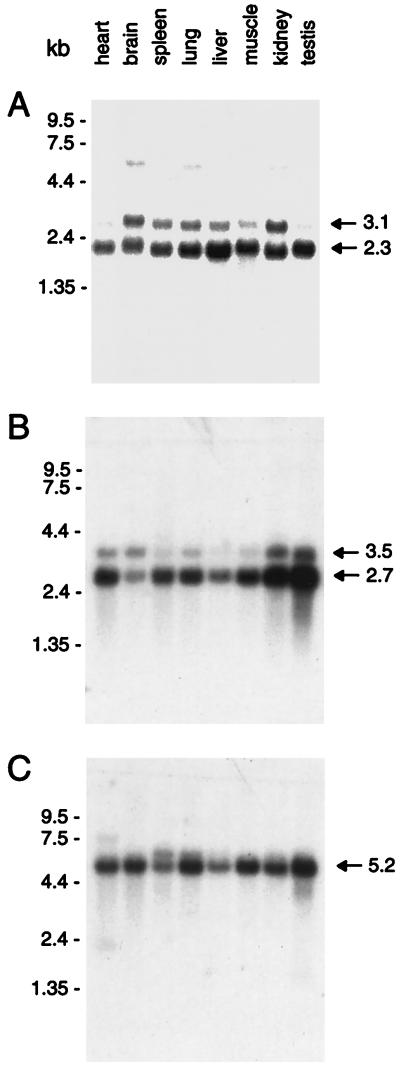
Figure 3.
Multiple tissue Northern blot analysis. Size markers are on the left in kb. (A) rexo70: Two transcripts of 2.3 and 3.1 kb are observed all tissues examined. (B) rsec15: Two transcripts of 2.7 and 3.5 kb are observed in all tissues. (C) rsec5: A major transcript of 5.2 kb is observed in all tissues.

