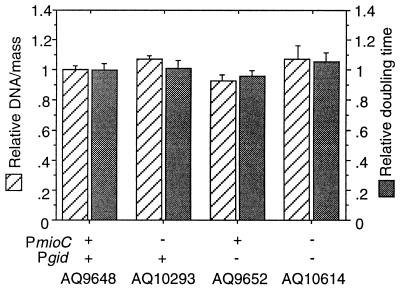
Figure 4.
DNA synthesis and growth rates of promoter mutants. Cells were grown in LB plus glucose at 37°C with aeration. DNA/mass values were obtained from flow cytometric analysis of exponentially growing cells. Doubling times were determined from cell counts with a particle counter. Values are averages of three independent analyses plotted relative to AQ9648 (18.8-min doubling time). Error bars indicate the standard deviation.

