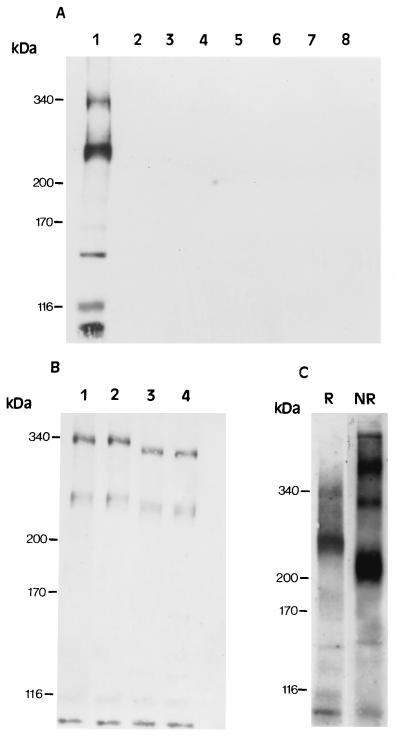
Figure 3.
Western blot analysis of otogelin using the 7.8 antiserum. Molecular mass standards (in kDa) are indicated on the left. (A) Tissue distribution of otogelin in the P15 mouse: inner ear (1), eye (2), brain (3), liver (4), intestine (5), kidney (6), spleen (7), and lung (8). (B) Deglycosylation assays of P2 mouse inner ear extracts: control buffer (1), neuraminidase (2), N-glycosidase (3), both enzymes (4). Note that the concentration of the diffuse 240–270-kDa band and the 170- and 150-kDa bands were weaker compared with 15-day-old extracts. (C) P15 mouse cochlear extracts in denaturing reducing (R) and nonreducing (NR) conditions (see Materials and Methods).

