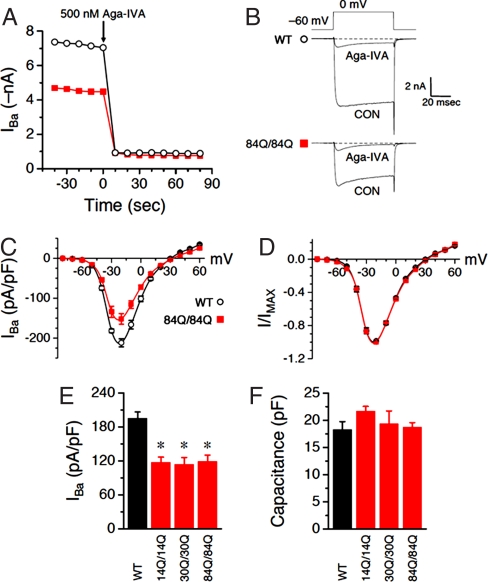
Fig. 3.
Whole-cell Purkinje Ba2+ currents are blocked by Aga-IVA and reduced in Sca6 neurons. (A) Time course of peak current for a WT (○) or an Sca684Q84Q (■) neuron. Aga-IVA was added to the bath when indicated, to a final bath concentration of ≈500 nM. (B) Individual traces from the two cells in A, before and after bath application of Aga-IVA. (C–F) Each group consists of 4–19 neurons. (C) Current density was plotted against voltage for WT (○) and Sca6 84Q/84Q (■) neurons. (D) Same data as in A, normalized to peak inward current. (E) Summary of whole-cell current density at −15 mV. *, P < 0.005 vs. WT (by two-tailed Student's unpaired t test). (F) Summary of whole-cell capacitance. P > 0.05 vs. WT for all three Sca6 populations. 14Q/14Q, 30Q/30Q, and 84Q/84Q represent Sca614Q/14Q, Sca630Q/30Q, and Sca684Q/84Q, respectively.

