
Figure 5.
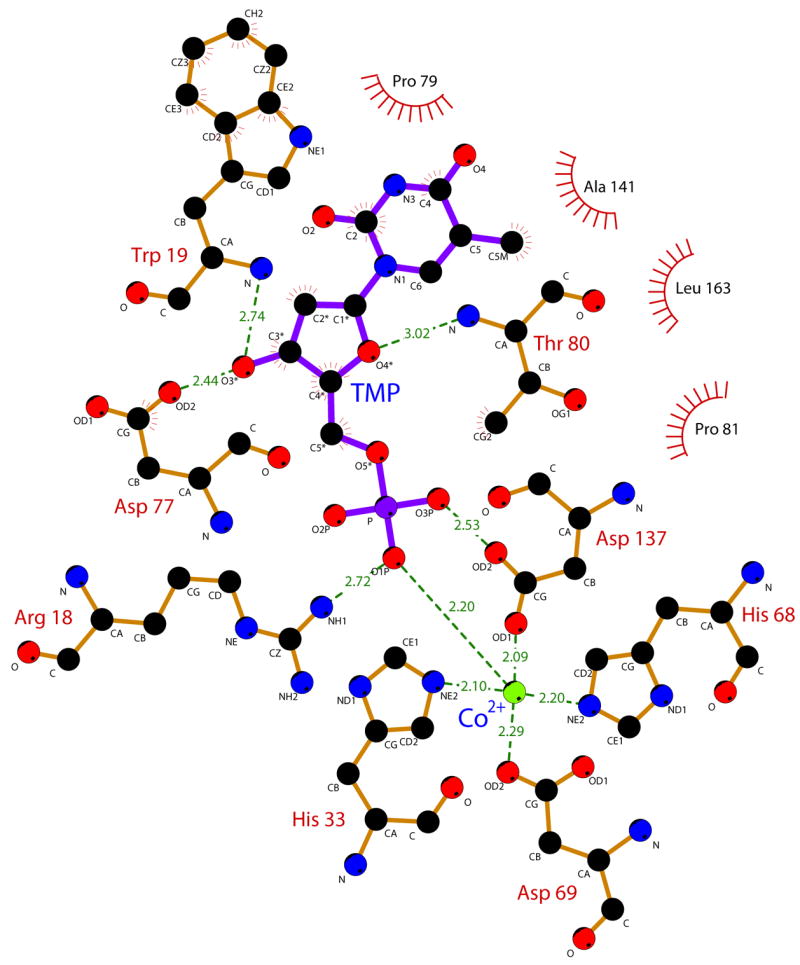
Schematic representation of the binding mode of TMP to YfbR E72A. Protein residues are shown with brown bonds, TMP is shown with purple bonds, and Co2+ is shown as a green sphere. Atoms and residues involved in van der Waals contacts are marked with red lines. Substrate-protein hydrogen bonds and cation contacts are shown as green lines, with bond distances in Å. The figure was generated using LIGPLOT56.