
Figure 2.
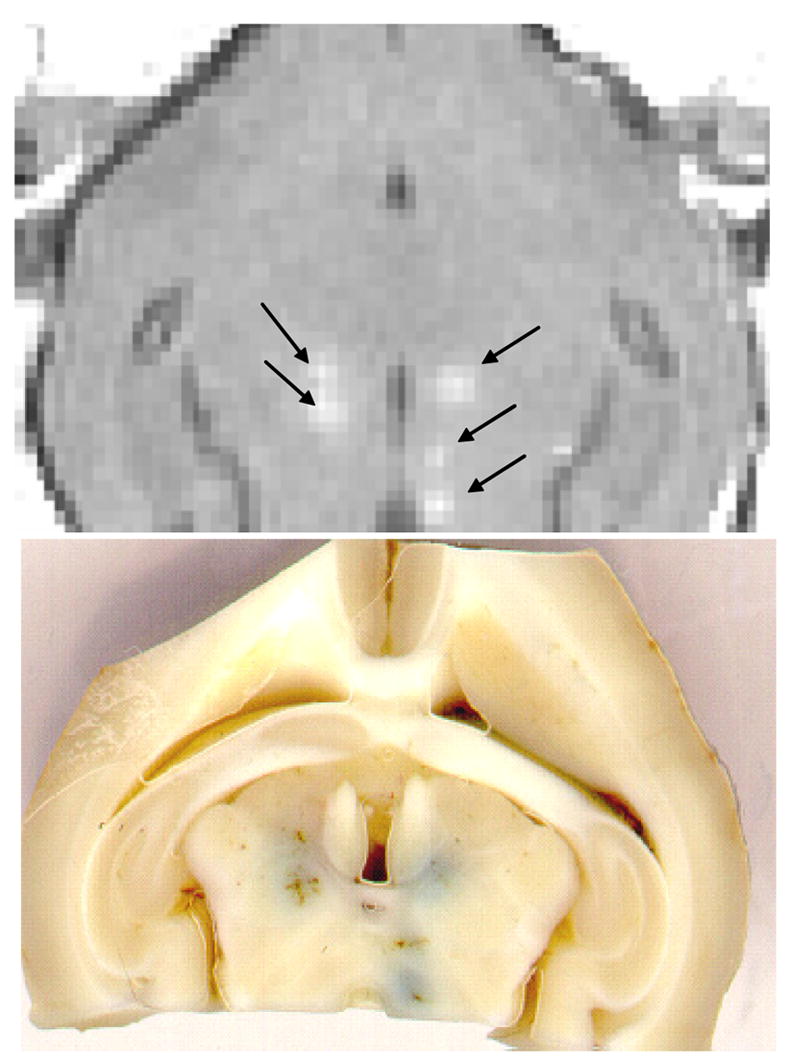
Top: An example of T1-weighted MR image of a rabbit brain obtained after five sonications (arrows) through a cranietomy and an injection of a bolus of gadolinium contrast agent. The image was acquired across the focus of the ultrasound beam and show local contrast enhancement at the sonicated locations. Bottom: The post mortem slice of the same brain showing trypan blue leakage at the sonicated location. The dye was injected a few minutes after the sonications.