
Figure 5.
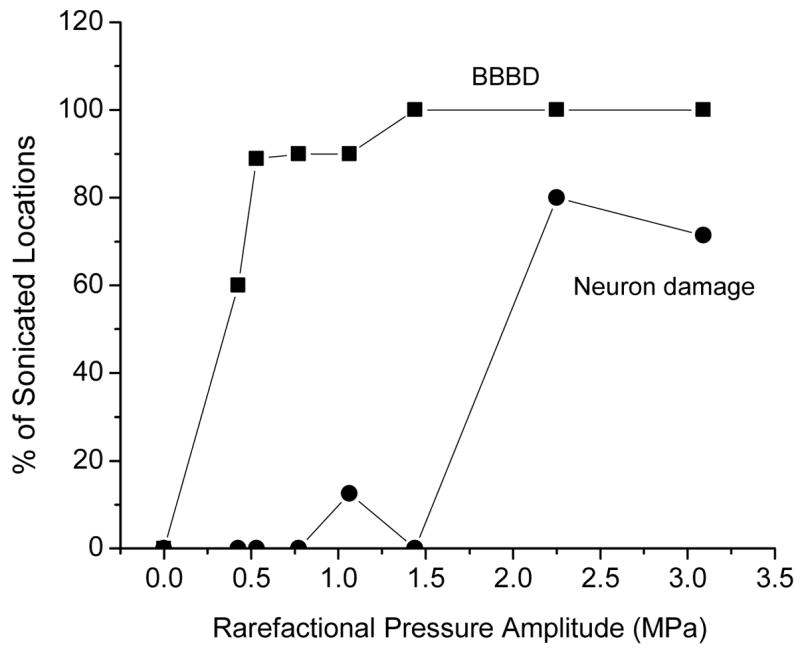
A. The percentage of sonicated locations in rabbit brain that showed contrast enhancement in T1-weighted MR images after sonication as a function the pressure amplitude during the 10 ms ultrasound bursts at the frequency of 0.68MHz. The sonications for this graph were done through a craniotomy window but the study demonstrated that equivalent response can be induced also through intact skull. The percentage of the locations that showed light microscopy evidence of neural damage is also plotted in the graph [42].