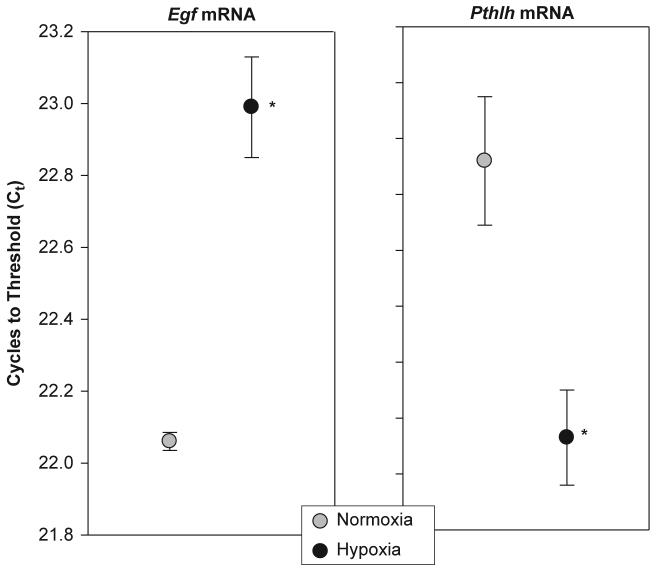
Fig. 2.
Effects of chronic hypoxiaon the expression of Egf and Pthlh mRNA in the maternal mammary gland. Dams and their newborn litters were placed in an environmental chamber at 21 %O2 (normoxia group) or 12 % O2 (hypoxia group) from birth to PD7. The units of the y-axis (C t)reflect the number of real-time PCR cycles needed to reach the signal intensity of a predetermined threshold value. Note that a decrease in the C t value indicates an increase in mRNA expression. Data are presented as mean±SEM.*Indicates asignificant difference from the normoxia group(p<0.05)(n=7-8samples per treatment).

