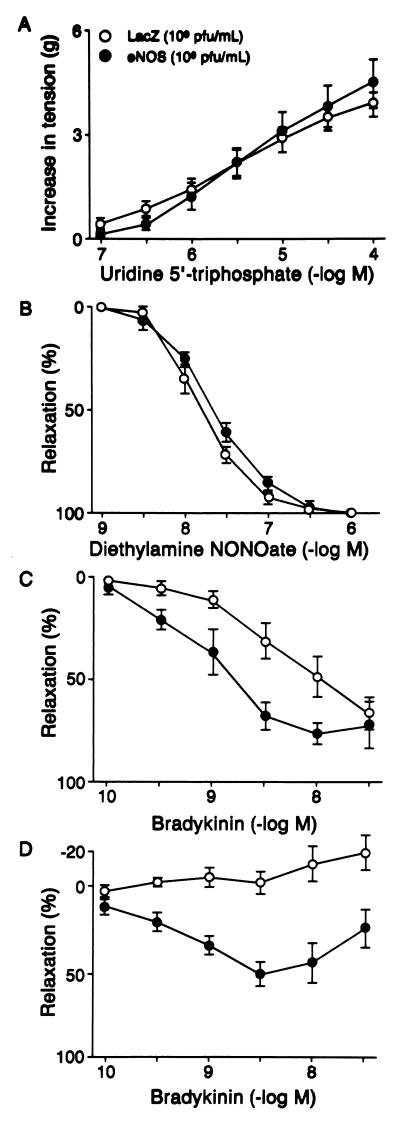
Figure 5.
Effects of transgene expression on contractions to UTP, relaxations to diethylamine NONOate and bradykinin in middle cerebral arteries 24 h after in vivo gene transfer. Shown are concentration-response curves to (A) UTP with endothelium (P > 0.05); (B) diethylamine NONOate with endothelium (P > 0.05); (C) bradykinin with endothelium (P < 0.05); and (D) bradykinin without endothelium (P < 0.05) (two-way RM-ANOVA). Data are expressed as means ± SEM (n = 8 for A and D; n = 4 for B and C). Contractions are expressed in grams, and relaxations are expressed as percentage of the maximal relaxation to papaverine (3 × 10⁻⁴ M).

