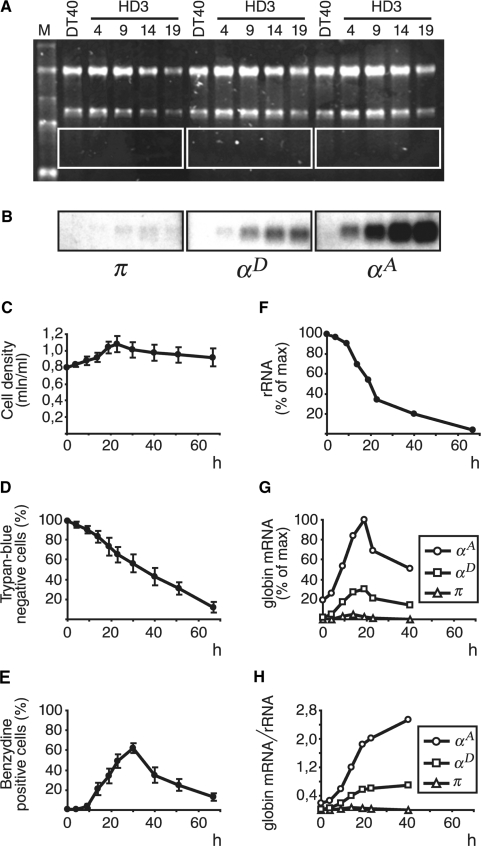
Figure 1.
Induction of erythroid differentiation of HD3 cells. (A) and (B) Northern-blot analysis of RNA from DT40 and HD3 cells at different time intervals after the beginning of induction. (A) Ethidium bromide staining of RNA after gel electrophoresis. M: RNA marker (0.24, 1.35, 2.37, 4.40, 7.46 kb); DT40: RNA from DT40 cells; HD3: RNA from HD3 cells; the figures indicate the time after the beginning of induction. (B) Autoradiographs showing the results of hybridization of probes recognizing π, αD and αA mRNAs with blots representing the framed areas in section A. (C–E) Kinetics of changes in cell density (C), percentage of living cells (D) and percentage of hemoglobin-containing cells (E) with time after induction. The data shown represent the average of the results of three independent experiments; error bars represent SEM. (F) Relative amount of rRNA (18S + 28S) in the slots. (G) Relative amount of globin mRNAs in the slots. (H) Relative amount of globin mRNAs normalized to the relative amount of rRNA. The density of bands was quantified using TotalLab 2 computer software (Nonlinear Dynamics, Newcastle, UK).

