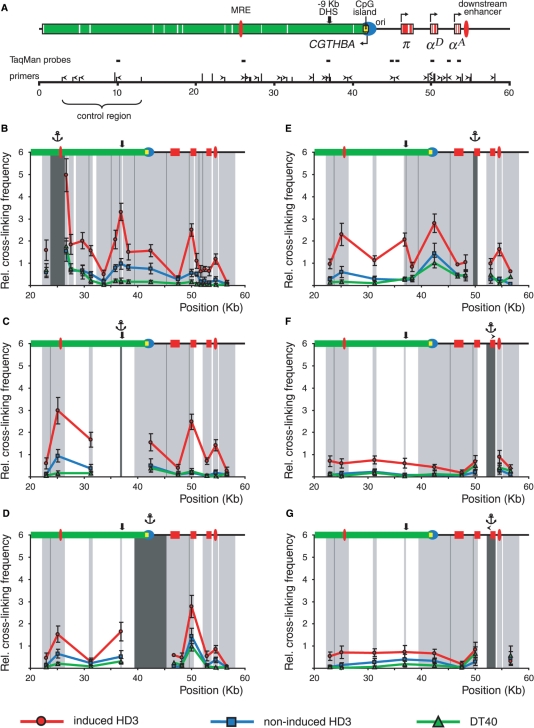
Figure 2.
BamHI/BglII 3C analysis of the chicken α-globin gene domain in non-erythroid and transformed erythroid cells. (A) A BamHI/BglII restriction map of the chicken α-globin gene domain and a scheme showing positions of important functional elements. Red boxes: α-globin genes, green box: CGTHBA gene (the white lines represent exons, the arrows show the directions of transcription); filled red ovals: MRE and the downstream enhancer; black bold arrow: −9 kb DHS; filled yellow rectangle: CpG island; blue circle: origin of replication. The long and short vertical lines above the scale show positions of BamHI and BglII restriction sites, respectively. The ‘0’ point in the map corresponds to the start of the AY016020 sequence (GeneBank) (4). Primers and TaqMan probes used for the 3C analysis are shown respectively by black horizontal tailless arrows and rectangles. (B–G) Relative frequencies of cross-linking between the anchor fragments bearing (B): MRE, (C): −9 kb DHS, (D): CpG island, (E): αD gene promoter, (F) and (G): αA gene and other fragments of the locus. The ‘x’ axis shows fragment positions according to the restriction map scale. On the top of each graph a scheme of the domain with the same symbols as in (A) is shown. The results of 3C analysis for induced HD3, cycling HD3 and DT40 cells are shown by the red, blue and green lines, respectively. The dark gray rectangle in the background of each graph with the anchor drawn above indicates a fixed (anchor) DNA fragment, and the light gray rectangles—test-fragments. The borders between the neighboring fragments are indicated by dark gray lines. The relative cross-linking frequencies (‘y’ axis) were calculated as described in the second paragraph of the ‘Results’ section. Error bars represent SEM for three independent experiments.

