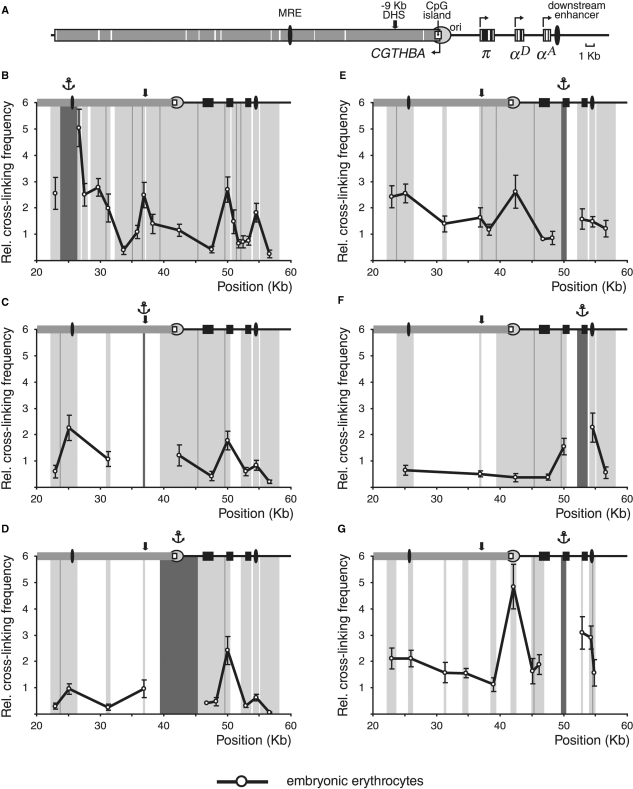
Figure 4.
3C analysis of the chicken α-globin gene domain in 10-day chick embryo erythrocytes. (A) A scheme showing positions of functional elements of the domain. Black boxes: α-globin genes; grey box: CGTHBA gene; black ovals: MRE and the downstream enhancer; open rectangle: CpG island; circle: origin of replication. The other designations are as in Figure 2. (B–G) Relative frequencies of cross-linking between the anchor fragments bearing (B): MRE, (C): −9 kb DHS, (D): CpG island, (E) and (G): αD gene promoter, (F): αA gene and other fragments of the locus [3C was performed with (B–F): BamHI and BglII restriction enzymes, (G): MboI restriction enzyme]. The other notations are as in Figure 2.

