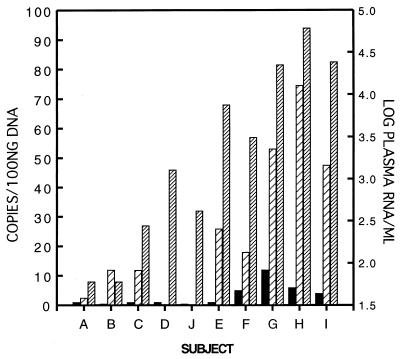
Figure 3.
Correlation of HIV RNA levels in plasma and HIV DNA copy numbers in PBMC and lymph node after one year of therapy. Values for HIV RNA in plasma are log10 copies per ml of plasma shown by densely hatched bars (right-hand axis). Values for HIV DNA are in copy numbers per 100 ng of cellular DNA or 16,000 cell equivalents (left-hand axis) shown as black bars for PBMC and sparsely hatched bars for LN. PBMC were obtained on the same day as the LN biopsy. HIV DNA copy numbers represent the mean of duplicate assays performed on the same DNA extract. No LN DNA extract was available for subject D. HIV DNA copy number in PBMC from subject B was approximately 1 in 64,000 cells. Quantitation from LN of patient J was omitted.

