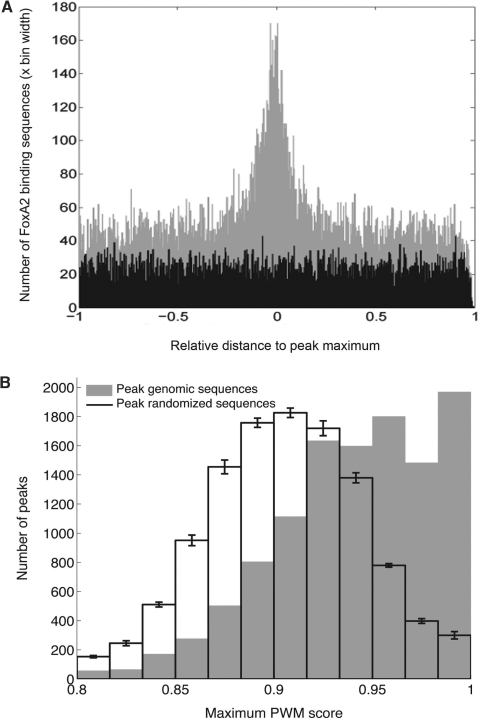
Figure 1.
(A) Distances from sites similar to Foxa2-binding sequences to the peak maximum, normalized to peak width. This graph shows that Foxa2-binding sequence sites tended to cluster around peak maxima. (B) Peak enrichment in Foxa2-like sequences, as assessed with PWM scan scores. The Foxa2 PWM used was created from the aligned sequences used to generate the sequence logo shown in Supplementary Figure 2 (see Methods section). The graph indicates that peak genomic sequences contained higher scoring Foxa2-binding sequences than randomized peak sequences; that is, peaks were enriched relative to a random expectation.

