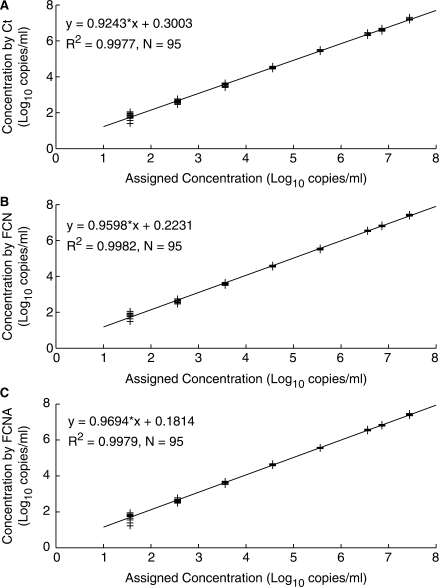
Figure 3.
Analysis by maxRatio of a RealTime HIV-1 linearity panel. HIV-1 RNA ranging from 7.44 log10 copies/ml to 1.56 log10 copies/ml were tested using the m2000sp and m2000rt instruments. (A) Observed versus assigned concentration calculated using Ct values. (B) Observed versus assigned concentration calculated using FCN values. (C) Observed versus assigned concentration calculated using FCNA values.

