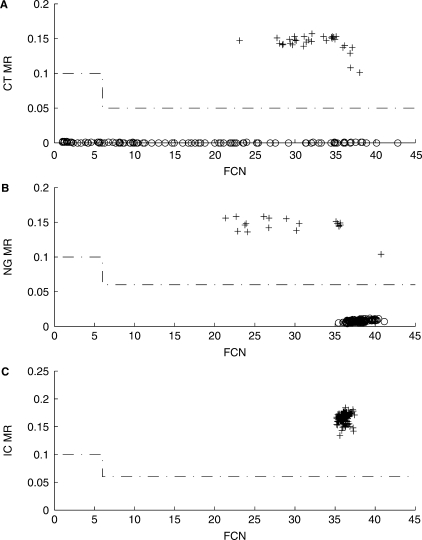
Figure 4.
Analysis by maxRatio of RealTime CTNG results. Representative MR–FCN plots of (A) C. trachomatis responses (B) N. gonorrhoeae responses and (C) IC responses. Each plot represents collated responses from three out of the 15 runs. Reactive samples are denoted with a plus plot symbol and nonreactive with a circle plot symbol.

