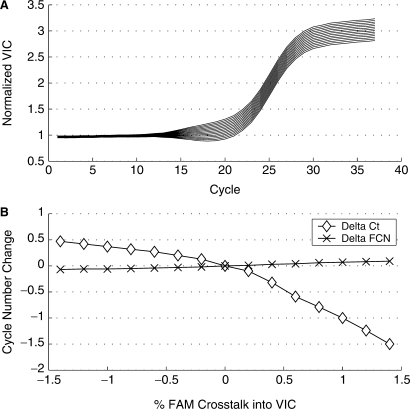
Figure 7.
Spectral crosstalk analysis of an IC response from a 6.86 log10 copy/ml RealTime HIV-1 sample. (A) Amplification plots of the modified VIC IC reactions. (B) Plot of the difference in Ct and FCN cycle numbers from an unmodified response shown. Ct values calculated based on a threshold of 0.3 and FCN values calculated from normalized VIC responses.

