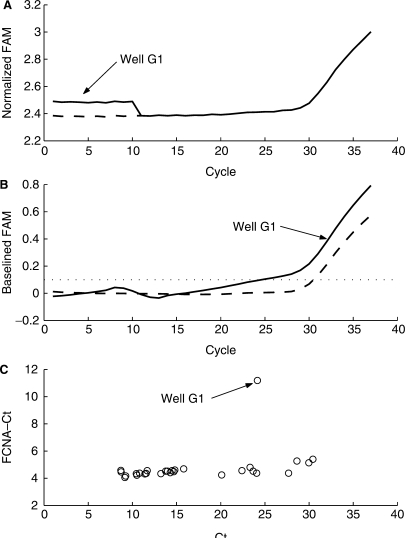
Figure 8.
Baseline anomaly of a RealTime HCV assay response. (A) Amplification plots of the HCV normalized FAM fluorescence versus cycle number. Solid line is actual response of well G1. Dashed line represents the same response with discontinuity removed. (B) Corresponding plots after Savitsky–Golay smoothing and baselining. (C) Plot of FCNA – Ct cycle difference versus Ct value for the 28 positive responses in the same PCR run.

