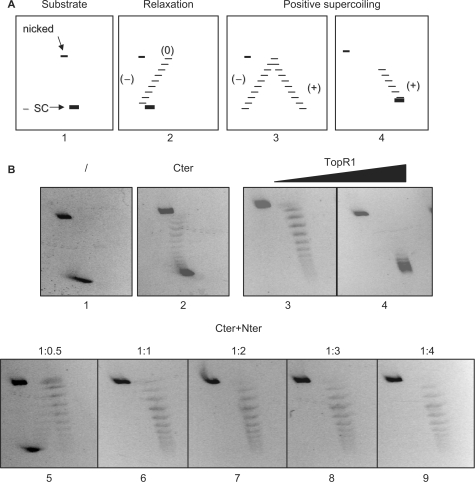
Figure 2.
Analysis of TopR1 and truncated enzymes topoisomerase activity by bi-dimensional agarose gel electrophoresis. (A) Diagram of 2D gels. Panel 1 shows the migration of the negative supercoiled (-SC) and nicked forms of the plasmid substrate. Panel 2 shows a ladder of negative to relaxed (0) topoisomers. Panel 3 shows the migration of a complete arc of negative to positive topoisomers; in panel 4 only positive topoisomers are shown. (B) Four hundred nanograms (final concentration 0.4 nM) of pQE31 plasmid DNA (ΔLk > −12) were mock incubated (/) or incubated with indicated enzymes for 10 min at 80°C in a final volume of 20 μl, and subjected to 2D agarose gel electrophoresis. All reactions contained 1 mM ATP and the following protein concentration: panel 2, Cter (30 nM); panels 3 and 4, TopR1 (30 and 60 nM, respectively); panels 5–9, Cter (30 nM) plus Nter (15, 30, 60, 90 and 120 nM, respectively). In all samples, total protein concentration was adjusted adding the required amounts of BSA.

