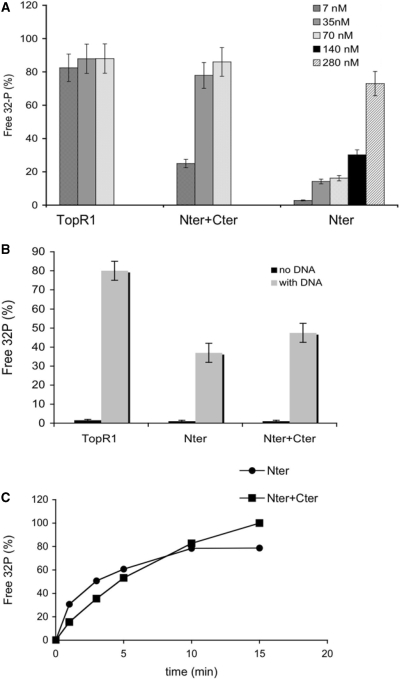
Figure 6.
Cter stimulates the ATPase activity of Nter. (A) The three enzymes were assayed using 32P-γ-ATP as reported in ‘Materials and Methods’ section. Shown are the final concentrations of TopR1 and Nter, alone or in combination with equimolar amounts of Cter. In all samples total protein concentration was adjusted with BSA. Incubation was for 10 min at 80°C with the addition of ss DNA (see ‘Materials and Methods’ section for details). The fraction of free 32P versus total radioactivity, corrected for the spontaneous ATP hydrolysis, is plotted. Assays were performed at least in triplicate and the results were averaged. Values are the mean ± SE of three independent experiments. (B) Dependence on DNA of the ATPase reaction. Assays were performed and analysed as described in the legend to Figure 6A, with or without DNA. Final concentrations were: TopR1 7 nM, Nter 140 nM, Cter + Nter 14 nM each. (C) Time course of the ATPase reaction. Reaction mixtures for Nter (280 nM) and Nter+Cter (70 nM each) were set and assayed for the indicated time spans at 80°C. Assays were performed and quantified as reported in the legend to Figure 6A.

