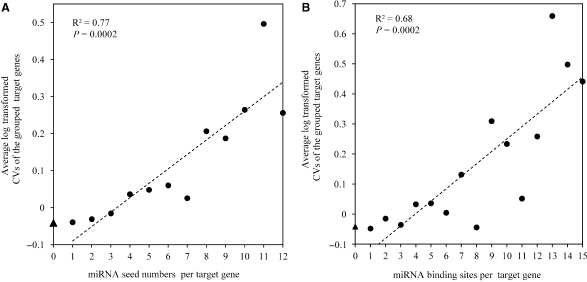
Figure 1.
Increased variability of gene expression is concomitant with the increased miRNA-mRNA interaction. (A) The correlation between miRNA seed numbers per target gene and the average CVs. The average CV of the non-miRNA-target genes is indicated in Y-axis by triangle. The dash line indicates the linear least square regression line. The R2 and P-value are indicated. The set of groups was restricted to those including at least 20 genes. (B) The correlation between miRNA binding sites per target gene and the average CVs.

