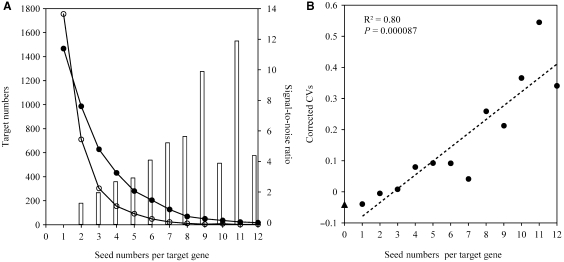
Figure 2.
Adjusting CVs by signal-to-noise ratio does not affect the positive correlation between miRNA seed numbers and CVs. (A) Plot of the number of target genes recognized by n seeds. The distribution for the real seeds (solid circles) is shown alongside the distribution for the random seeds (hollow circles). The line bar indicates the ratios of the number of transcripts with n seeds for real versus random seeds and the right Y-axis represents the signal-to-noise ratio. (B) The correlation between miRNA seed numbers per target gene and the adjusted CVs. The average CV of the non-miRNA-target genes is indicated in Y-axis by triangle. The dash line indicates the linear least square regression line. The R2 and P-value are indicated.

