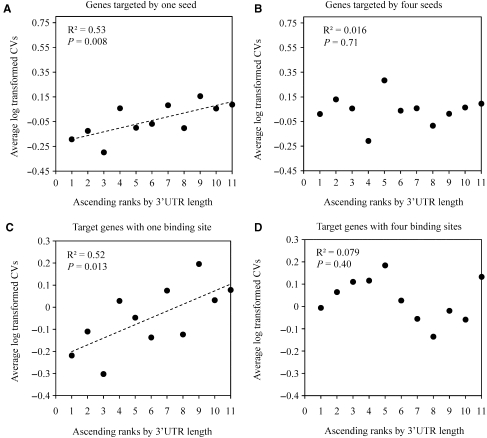
Figure 3.
Examples of relationship between 3′UTR length and CVs. (A) Genes recognized by one seed were ascendingly ranked according to their 3′UTR lengths and incorporated into eleven groups with the same gene number. Spearman's rho was calculated between the 3′UTR ranks and the average CVs of each group. The positive correlation was identified. (B) For genes targeted by four seeds, using the same grouping approach, no correlation was identified between the 3′UTR ranks and the average CVs. (C) For genes with one miRNA binding site, using the same grouping approach, the positive correlation was identified. (D) For genes with four miRNA binding sites, using the same grouping approach, no correlation was identified.

