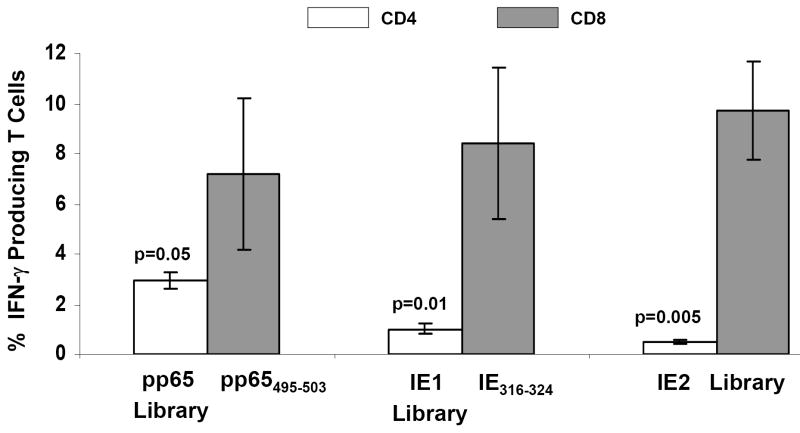
Figure 3. Immunogenicity of pp65-IEfusion-MVA in HHDII mice.
A) Percentage of IFN-γ producing splenocytes specific for pp65, IE1 and IE2 (x axis) in three mice immunized with 50 million pfu of pp65-IEfusion-MVA. Grey bars represent pp65-, IE1- and IE2-specific IFN-γ production by CD8+ T-cells using either peptide epitopes or libraries (identified below the x axis) during IVS and ICC stimulations. Unfilled bars represent simultaneous pp65-, IE1- and IE2-specific IFN-γ production by CD4+ T-cells, following IVS and ICC stimulation with the corresponding CMV libraries indicated below each set of bars. IVS and ICC stimulation conditions are described in M&M. In all graphs, error bars represent standard error of the mean among the immunized mice (N=3). In all experiments, IFN-γ production to mock stimulated cells was subtracted. P values indicate statistically significant differences measured by T-test.

