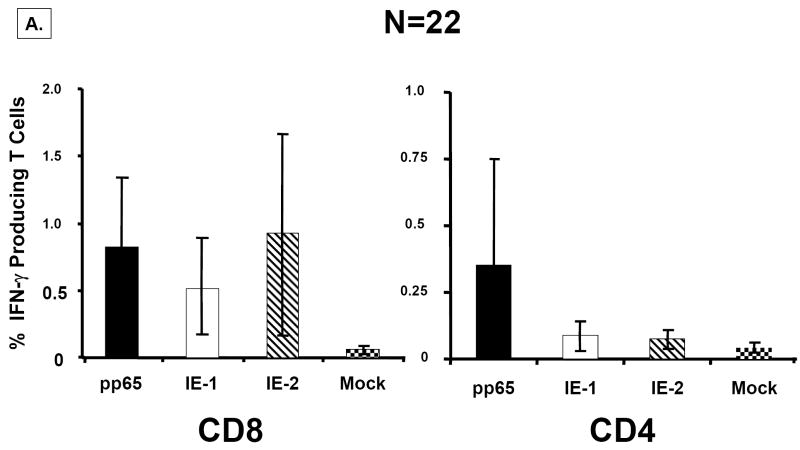
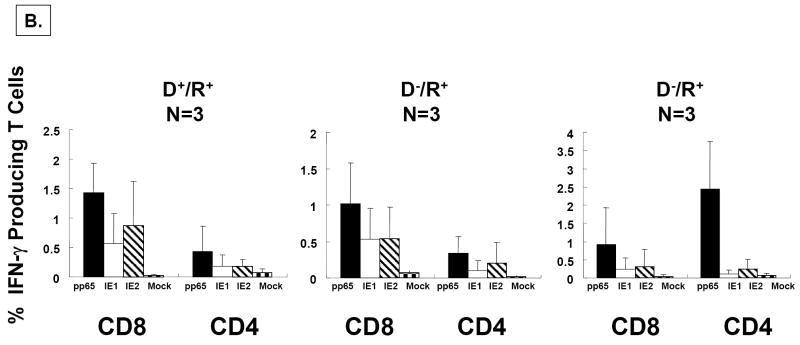
Figure 5. Ex vivo response to pp65, IE1, and IE2 peptide libraries.
A) Responses in healthy volunteers. PBMC were obtained from N=22 healthy volunteers for which we had complete HLA typing. Five million PBMC were divided into four aliquots and were individually co-incubated with peptide libraries at 1μg/ml/peptide in single use aliquots as described in Materials and Methods. PBMC from each individual were treated in separate cultures with each peptide library at the same time, but not all individuals were evaluated on the same day. Standard gating procedures were employed for each individual flow acquisition, such that conditions were standardized for all evaluations. Separate aliquots from the ICC assay were incubated with CD4+, CD8+ or isotype control antibodies as described in Materials and Methods. The plots show the percentage of IFN-γ producing T Cells for each of the antigen-specific peptide libraries. Error bars represent the standard error of the mean calculated using Microsoft Excel statistical package. B) Ex vivo response of PBMC from HCT recipients. Three examples from each of three separate risk categories of HCT shown in 3 separate plots (L-R; D+/R+, D-/R+, D-R+) based on CMV status were evaluated for response against peptide libraries using the same technical approach as described in A). Data from all 3 individuals was averaged in each category, and the error bars represent the standard error of the mean.


