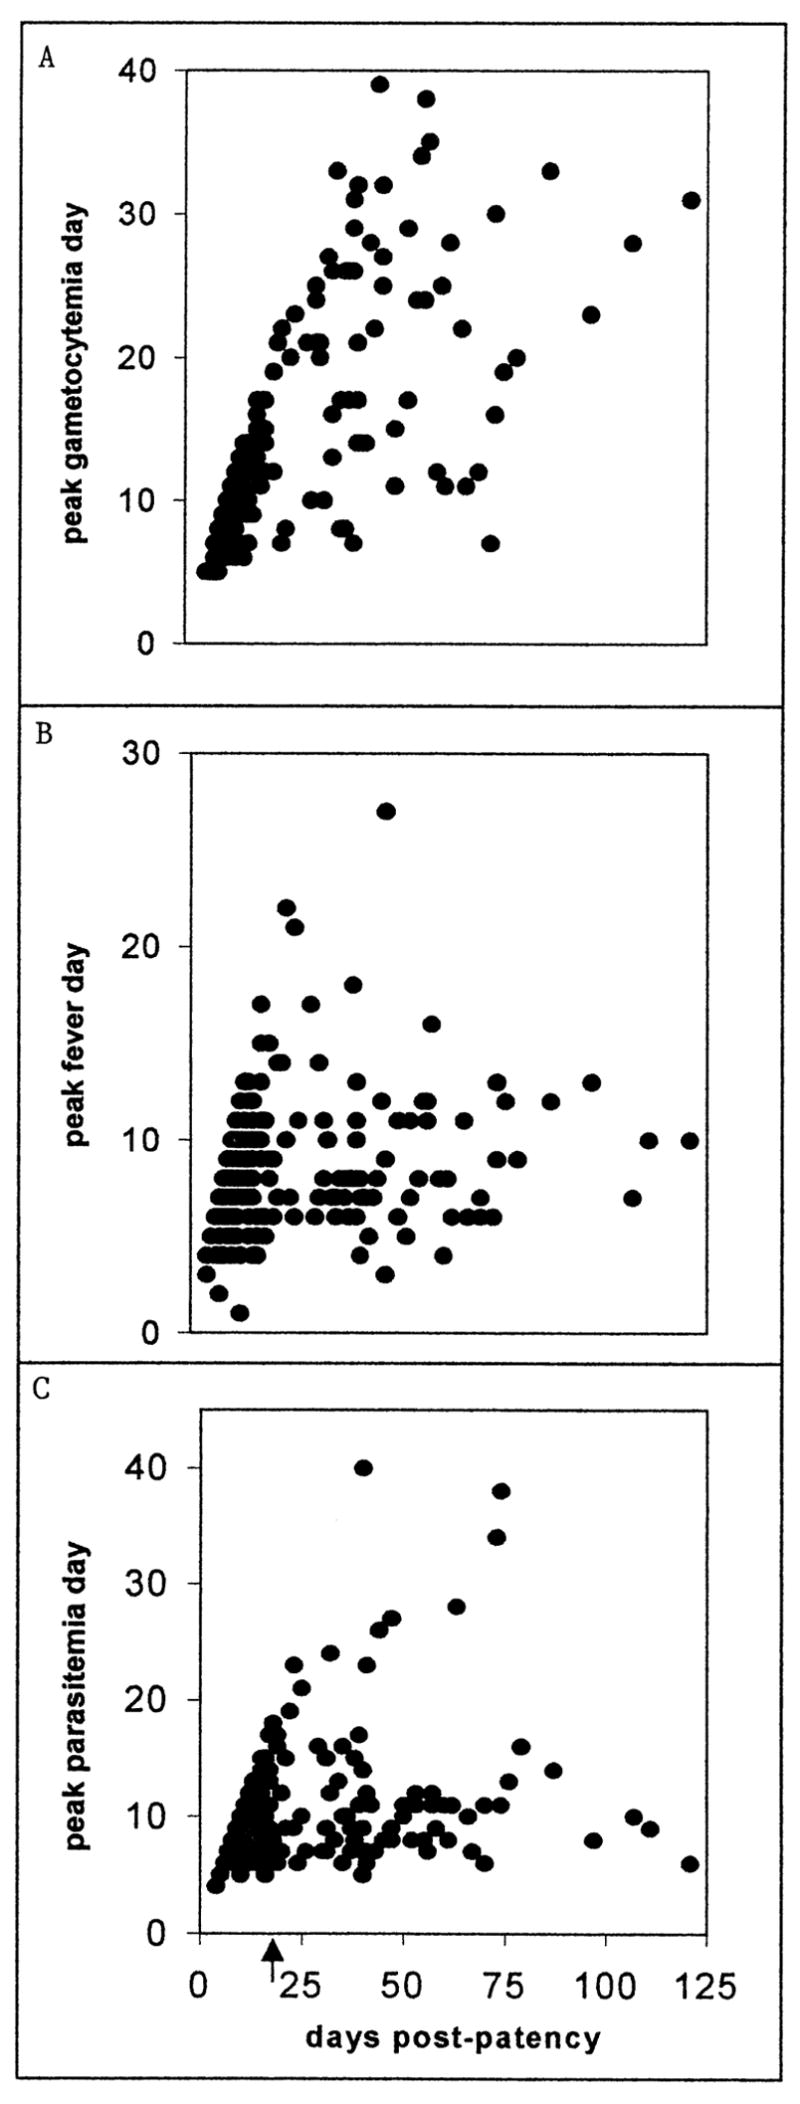
Figure 1.

The day of patent infection on which the peak gametocyte density (A), peak fever (B), and peak asexual-form density (C) occurred (vertical axes) plotted against the overall number of days of patent infection before intervention in the corresponding individual chart (horizontal axis). The arrow indicates day 14 of patency (see text).
