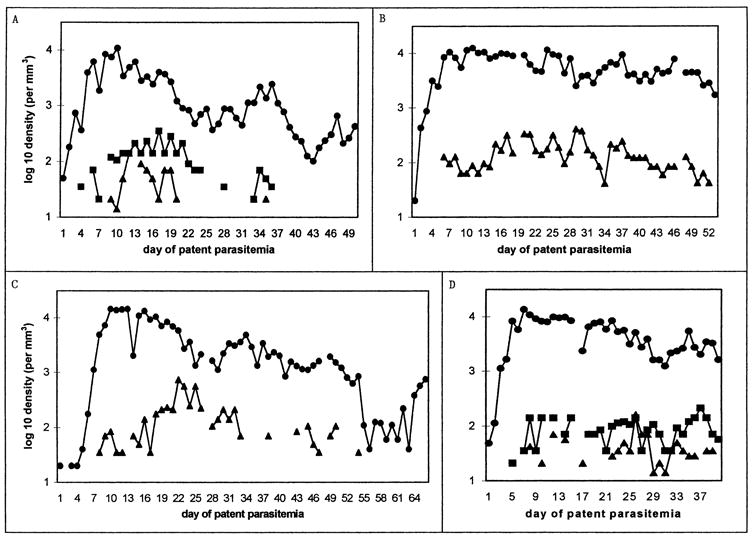
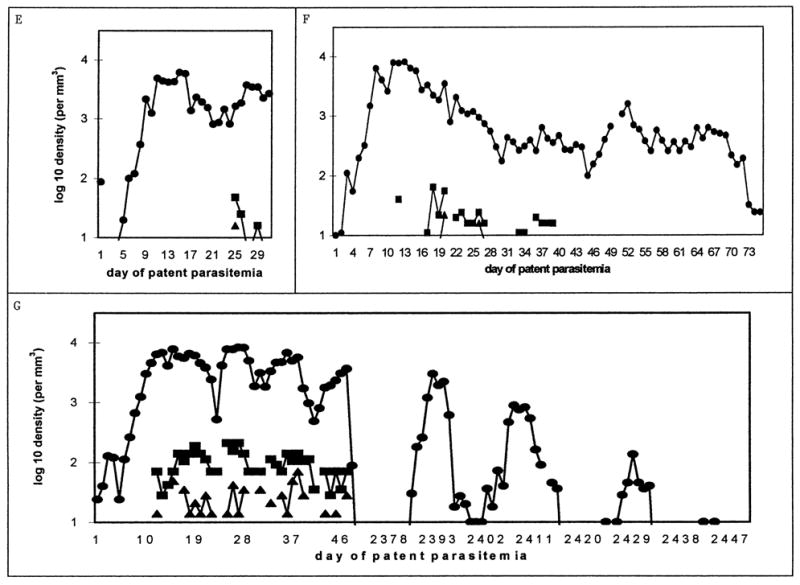
Figure 3.


Examples of charts with more than 14 days of preintervention patency. For each chart, the line graph shows log 10 parasitemia (as circles) and gametocytemia (males as triangles, females as squares) per cubic millimeter of blood, plotted from the first day of patent parasitemia to the last day before intervention. Patient identification numbers and days plotted are (A) S-611, 50 days; (B) S-554, 53 days; (C) S-533, 66 days; (D) S-757, 40 days; (E) S-1084, 31 days; (F) S-932, 76 days; (G) S-772, 50 and 60 days (see following text). Single tertian intervals between “local peaks” in parasitemia are most evident in B (days 35–43) and D (days 20–28). Note that only males were reported in B and C (see text). The patient in part G was treated with atabrine (1 g on day 47, 400 mg daily on days 48–53) and reinoculated with St. Elizabeth P. vivax 76 mo later.
