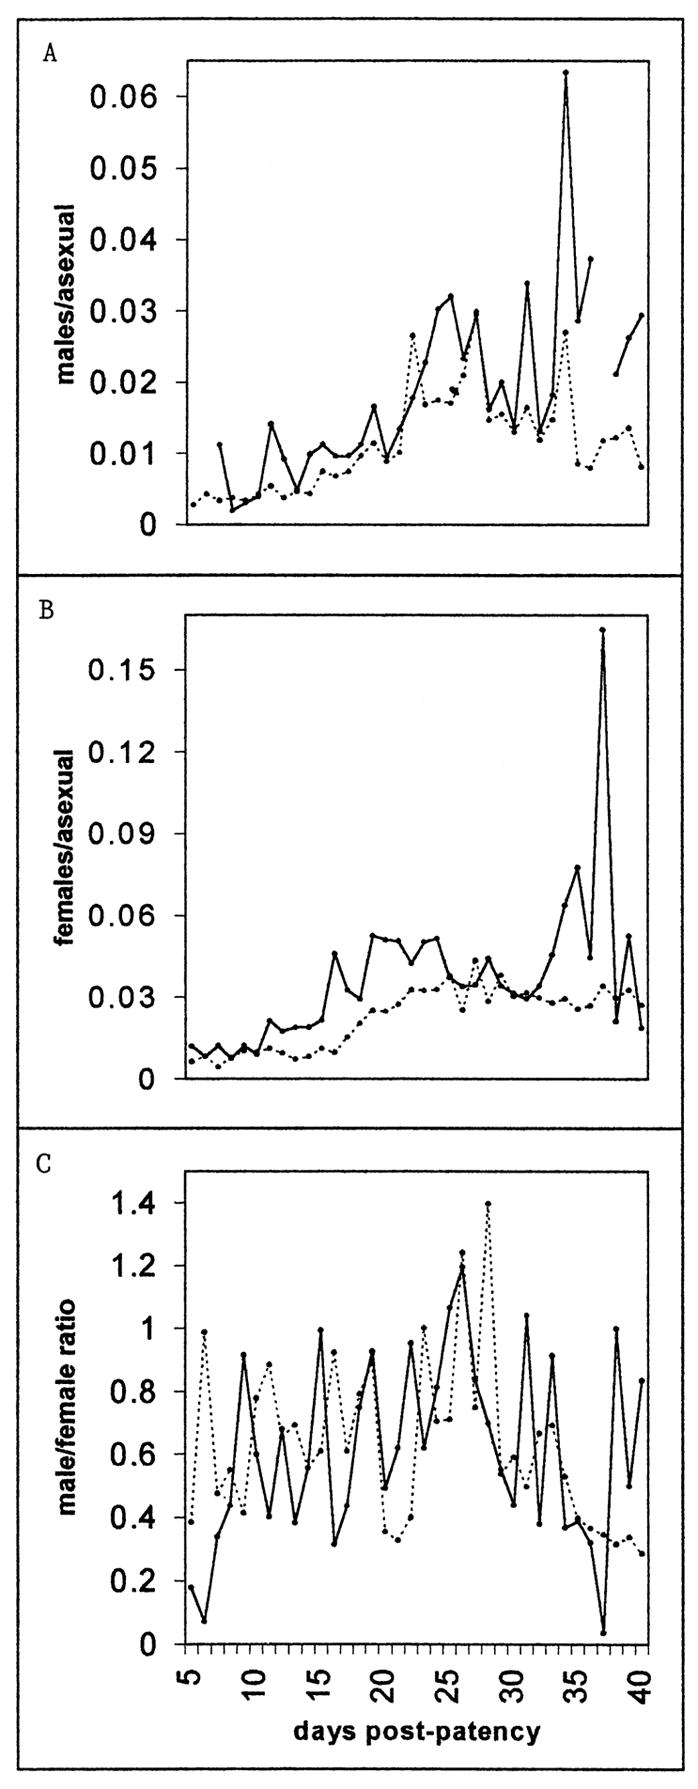
Figure 5.

The day-by-day course of the mean male (A) and female (B) gametocytemia per asexual form and the gametocyte sex ratio (C) between days 5 and 40 of patency. Only charts in which each gametocyte sex was reported on at least 1 day were included; charts in which the sex ratio exceeded 10 were excluded (4 charts, on a total of 11 days). If the density of only 1 sex was recorded on a given day, the density of the other on that day was set at 5 mm−3 (the threshold of detection was roughly 10 mm−3). The solid line represents sporozoite-induced infections, the dotted line trophozoite-induced infections.
