
Figure 1.
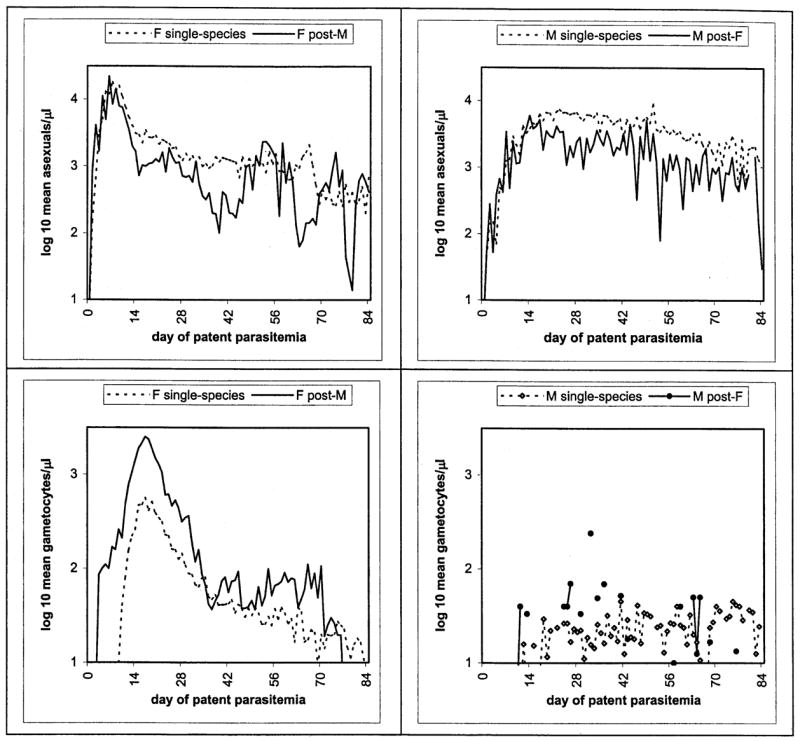
Plots comparing single-species P. falciparum (F, left panels) or P. malariae (M) infections with those that followed or accompanied cross-species infections, in terms of mean daily asexual-form (top panels) and gametocyte densities.
Official websites use .gov
A
.gov website belongs to an official
government organization in the United States.
Secure .gov websites use HTTPS
A lock (
) or https:// means you've safely
connected to the .gov website. Share sensitive
information only on official, secure websites.
Plots comparing single-species P. falciparum (F, left panels) or P. malariae (M) infections with those that followed or accompanied cross-species infections, in terms of mean daily asexual-form (top panels) and gametocyte densities.