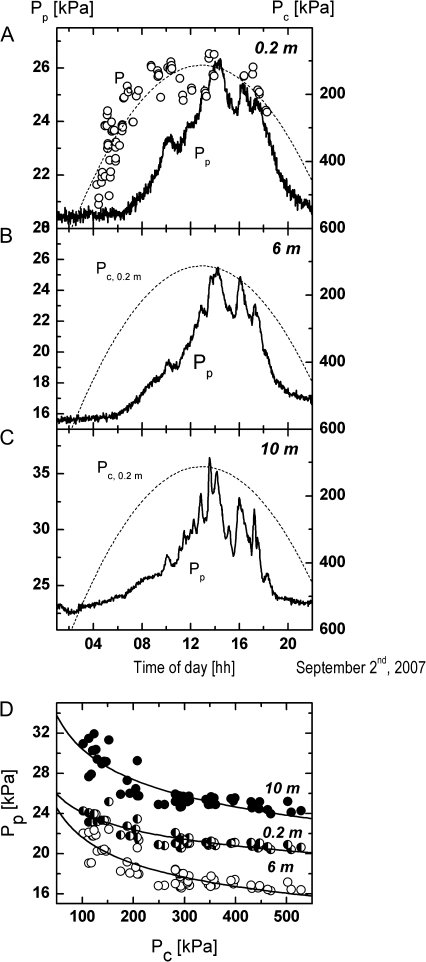
Fig. 5.
Diurnal recordings of cell turgor pressure, Pc, at 0.2 m height (A) and of leaf patch clamp pressure, Pp, at 0.2 m (A), 6 m (B), and 10 m height (C). The Pc recordings (circles; 77 data points) were performed on the same leaflet as the Pp measurement at 0.2 m height. Measurements were performed at the beginning of September after several days of irrigation. The microcapillary of the turgor pressure probe was inserted into parenchymal cells located close to the main vein on the abaxial side of a leaflet whereas the leaf patch clamp pressure probe was clamped about 2 cm away from the leaflet periphery as in the experiments shown in Figs 2 and 3. The delay between the Pp responses at the different heights and the changes in Pc at 0.2 m height increased from 10 m height (1 h) to 6 m height (1.5 h) and 0.2 m height (2.5 h). (D) shows that the relationships between Pp and Pc (56 data points measured during the morning hours) could be fitted by equation 8 if the delay between the response of Pc and Pp values upon environmental changes were not taken into account (fitting parameters: 0.2 m: Pin=50 kPa, a=9.38, b=0.99 kPa; 6 m: Pin=65 kPa, a=5.41, b=1.40 kPa; 10 m: Pin=70 kPa, a=6.58, b=2.73 kPa).

