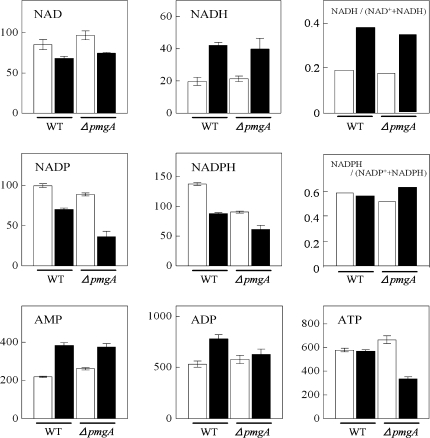
Fig. 5.
Amounts of adenine- and pyridine-nucleotides. Wild-type and ΔpmgA mutants were grown photoautotrophically (white bars) or photomixotrophically (black bars) for 24 h, and then metabolite contents were quantified. Each value represents the means ±SD of three independent experiments (nmol g−1 fresh weight).

