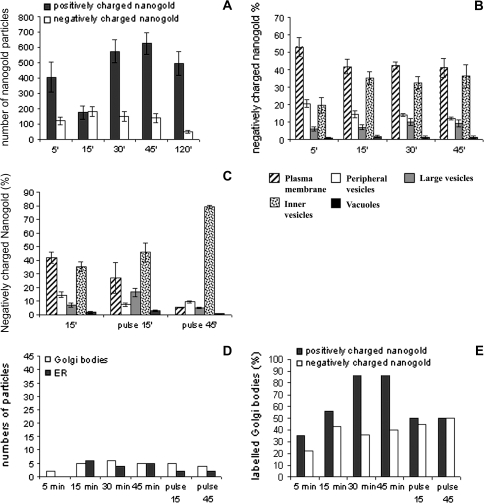
Fig. 9.
Quantitation of negatively charged nanogold internalization. (A) Variation in the total amount of particles counted in each sample during the time-course. (B) Distribution of probe in different compartments during the time-course. (C) Distribution of the probe in different compartments and during pulse chase. Quantitation of negatively charged nanogold was performed as for positively charged nanogold. A lesser amount of negatively charged nanogold was found in the cells compared with positively charged nanogold (A); after the uptake, the negatively charged nanogold was mostly delivered to inner vesicles (B, C) and to the degradation pathway, while the recycling to PM is slower or does not occur. (D, E) In ER and Golgi bodies the amount of probe and the percentage of labelled Golgi bodies were lower with respect to positively charged nanogold. The amount of particles in Golgi bodies and ER and the percentage of labelled Golgi bodies remained constant during pulse. Standard error (SE) is shown for each experiments.

