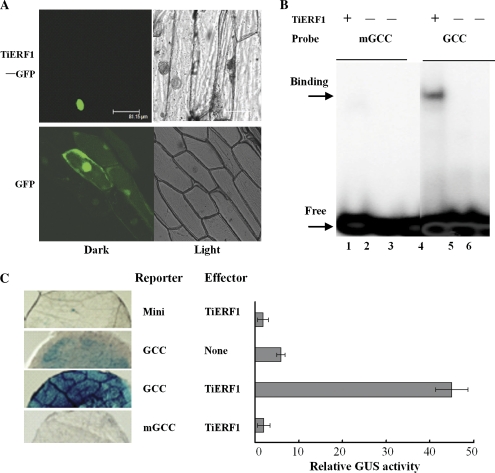
Fig. 2.
(A) Subcellular localization of TiERF1–GFP fusion protein in onion cells. The GFP fluorescence images in onion epidermal cells are shown for 35S::TiERF1–GFP localization in the nucleus (top) compared with the control 35S::GFP distributed in the whole cell (bottom). (B) Electrophoretic mobility shift assay. Lanes 1 and 4, GST–TiERF1 plus labelled mGCC or GCC, respectively; lanes 2 and 5, GST protein plus labelled mGCC or GCC, respectively; lanes 3 and 6, only labelled mGCC or GCC, respectively. Arrows indicate the TiERF1–GCC box binding band (B) and free probe (F). (C) Transcriptional activation of TiERF1 in tobacco. Reletive histochemical GUS activity as a result of activation of the GUS reporter gene by TiERF1. The bar indicates the standard error of the data (±SE).

