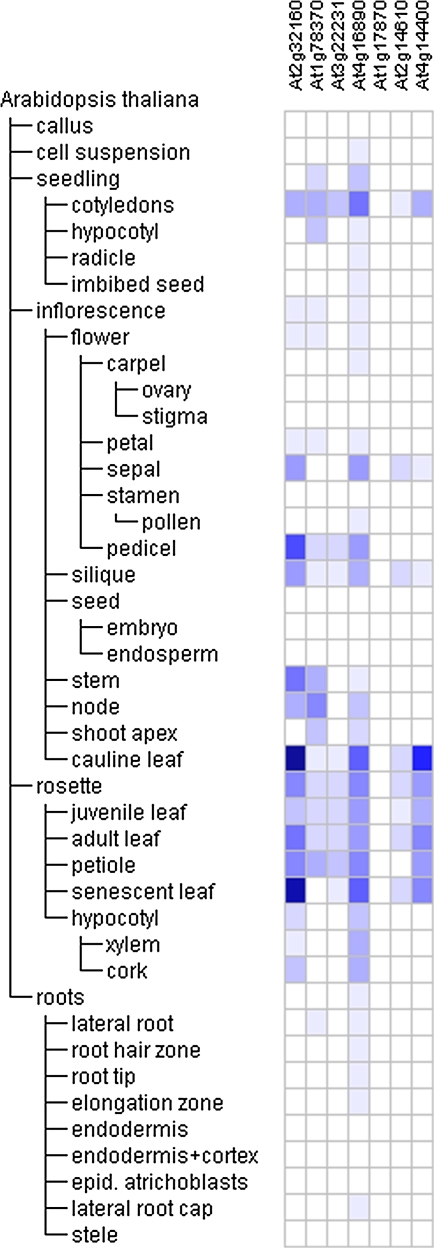
Fig. 3.
Heat map showing the levels of Arabidopsis gene expression throughout one plant life cycle. The Meta-Profile Analysis tool of the Genevestigator software (https://www.genevestigator.ethz.ch/) was utilized with a probe set for seven genes up-regulated by all three allelochemicals. The blue–white scheme was chosen by the software developers to visualize gene expression levels and discern slight changes in signal intensity. The colour/intensity for each gene expression profile was normalized such that the highest signal intensity was defined as 100% (dark blue), and the absence of signal was defined as 0 (white).

