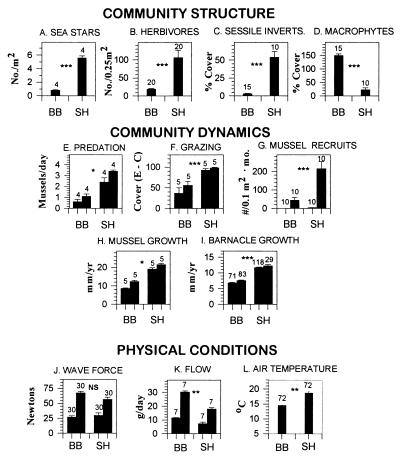
Figure 1.
Summaries (means ± 1 SEM) of community structure patterns, community dynamics, and physical conditions at wave-exposed sites at BB and SH. Sample numbers (numbers above error bars) were as follows: for community structure, quadrats; for predation and grazing, replicated experiments; for mussel recruitment, collectors/month; for mussel growth, transplant clumps (50 mussels/clump); for barnacle growth, individuals in each of two transplants/site; for wave force, daily measurements; for flow, 3 to 4-day measurements; and for air temperature, days of measurement. With the exception of grazing (F; see text) and temperature measurement (L), methods are in refs. 21, 27, and 31. Low tide air temperatures were obtained using battery-powered waterproof dataloggers (Alpha Omega model 9102). Analyses for differences between sites depended on the comparison. In all cases visual inspection indicated that residuals were normal and error terms were independent. All data were log- or arcsin-transformed before analysis. Probabilities: ∗∗∗, P < 0.0001; ∗∗, P < 0.001; ∗, P < 0.01; NS, not significantly different. Specific tests: for macrophytes and sessile invertebrates, MANOVA; for herbivore abundance, sea star abundance, sea star predation rate, herbivore grazing, mussel growth, and barnacle growth, ANOVA; for mussel recruitment, wave forces, and flow and temperature, repeated measures ANOVA. In MANOVA, probabilities were Bonferroni-adjusted by the number of tests (i.e., P = 0.05/2, or 0.025). Pairs of bars in E–H, J, and K indicate minimum and maximum values observed when studies were repeated in space (E, F, and H) or time (E, G, H, J, and K). In F, ordinate label is the difference in percent cover of microalgae in −grazer plots (E for exclosures) and +grazer plots (C for control).

