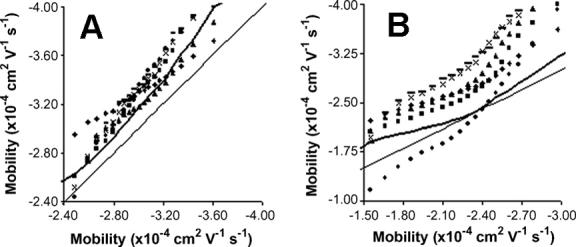
Figure 4.

Quantile-Quantile plots of the distributions of mitochondria undergoing adsorption to the capillary surface. The x-axis is the average of the quantiles from the three largest distributions and the y-axis is the quantiles from individual distributions. The thin line represents the reference line and the heavy line represents 1.5 SD from the reference line. A) Mouse liver mitochondria separated on uncoated capillaries. B) Rat liver mitochondria separated on PVA coated capillaries.
