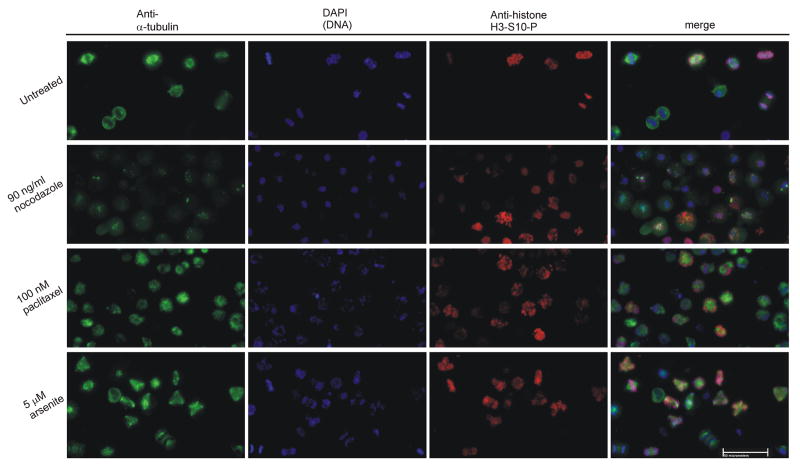
Figure 2. Analysis of spindle in mitotic cells.
HeLa cells were grown in drug free media in 15 cm dishes, while cells treated with 90 ng/ml nocodazole, 100 nM paclitaxel, or 5 μM arsenite were grown in 6 cm dishes for 15 h. Detached cells were shaken, pelleted, and adhered to poly-D-lysine slides before fixation and staining with anti-α-tubulin (AlexaFluor 488, green), anti-histone H3-S10-P (a mitotic marker, AlexaFluor 594, red), and DAPI (blue). Cells were analyzed and photographed via fluorescence microscopy. Representative examples of three independent experiments are shown. White bar represents 50 micrometers.

