
Figure 2.
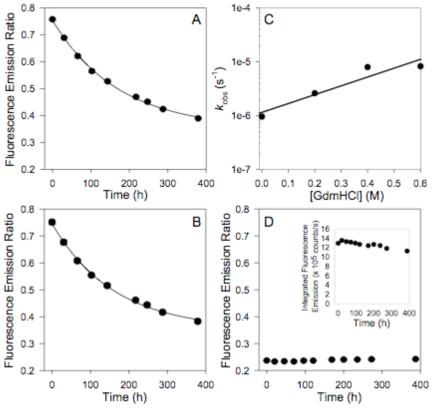
Dissociation of [PA63]7*FRET. A) Rapid dilution of [PA63]7*FRET from 10 μM to a final concentration of 10 nM. Dissociation (decrease in FRET) was monitored over time by measuring the fluorescence emission ratio (570 nm/520 nm; 488 nm excitation). Error bars represent 95% c.l. B) Competition of 10 nM [PA63]7*FRET with 200 nM unlabeled [PA63]7. Dissociation (decrease in FRET) was monitored over time by measuring the fluorescence emission ratio (570 nm / 520 nm; 488 nm excitation). Error bars represent 95% c.l. C) Plot of recovered kd vs. [GdmHCl] for the rapid dilution of [PA63]7*FRET with low concentrations of GdmHCl (0 - 0.6 M) added to accelerate the observed dissociation rate. D) Controls: The fluorescence emission ratio of an equimolar mixture of PA83 K563C*488 and PA83 K563C*546 (unnicked) was monitored over time. The inset shows the integrated intensity over the course of an experiment. Error bars for both controls represent the 95% c.l. All experimental kinetic transients were fitted to a single-exponential decay model to recover kd. All experiments were conducted at 20°C.