
Figure 4.
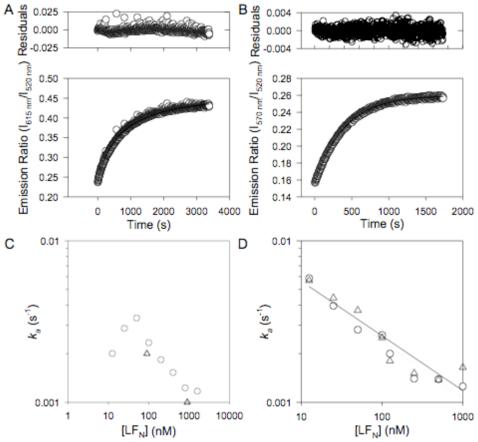
Determination of the association rates for [PA63]7*FRET and [(PA63)2·LFN]*FRET. A) Representative data for oligomerization of PA63 in the presence of LFN. An equimolar mixture of nPA83 K563C*488 and nPA83 K563C*594 (12 nM total nPA83) where LFN (100 nM) was added at t = 0. The increase in FRET due to PA63 association was monitored by fluorescence emission ratio. Data fit to a second-order model (Eqn 2). Residuals are shown in the upper plot. B) Representative data for the dimerization of non-oligomerizing PA83 mutants in the presence of LFN. An equimolar mixture of nPA83 D512K K563C*488 and nPA83 K199E R468A R470D K563C*546 (12 nM nPA83 total) where LFN (100 nM) was added at t = 0. The increase in FRET due to the association of PA63 was monitored by fluorescence emission ratio. Data fit to a second-order model. Residuals are shown in the upper plot. C) Graph of observed rate constant (ka) for PA63 association vs. concentration of LFN. Circles represent data for 12 nM nPA83; triangles represent data for 150 nM nPA83. D) Graph of observed rate constant (ka) for PA63 dimerization of non-oligomerizing PA83 mutants. Circles represent data for 12 nM nPA83; triangles represent data for 120 nM nPA83. Data are fit by linear regression (solid line, 12 nM nPA83; dotted line, 120 nM nPA83).