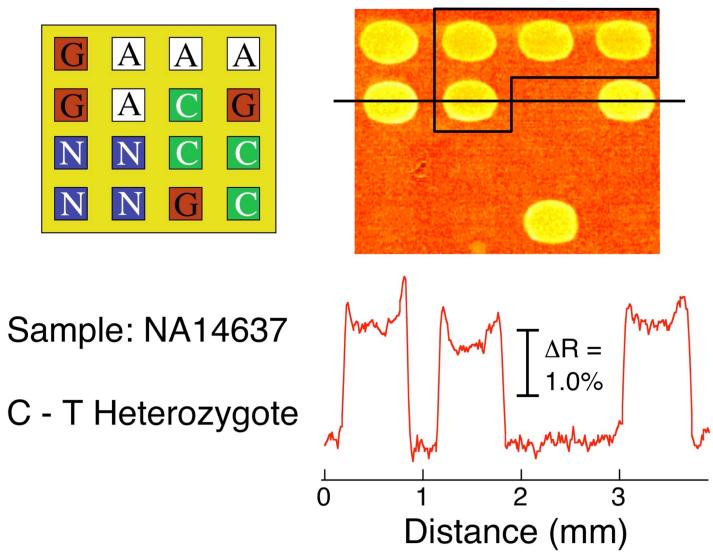
Figure 5.
SNP genotyping of a 1 nM PCR amplicon of genomic DNA sample NA14637. An SPR difference image was obtained by subtracting images taken before and after the exposure of LC-modified nanoparticles to a ligated microarray prepared in an identical manner to that in Figures 3 and 4. The array pattern and corresponding line profile are also shown. The SPRI signal increase observed at both the PG and PA (boxed) elements identifies the NA14637 sample as a C-T heterozygote.

