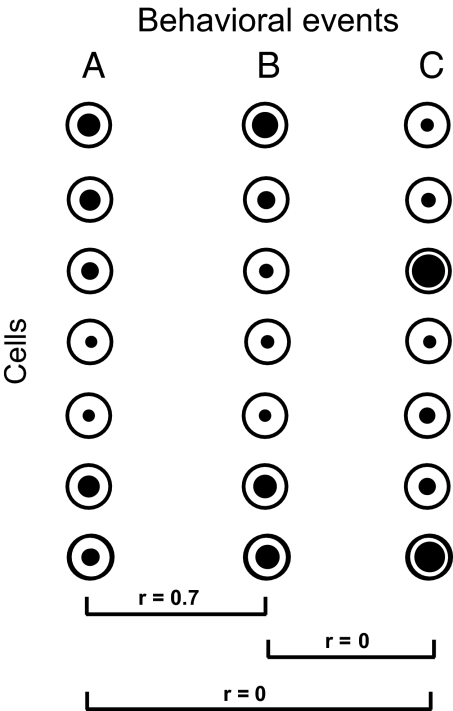
Fig. 1.
Distributed population codes for different behavioral events. Activity levels (black dots) are shown for a fixed cell population, coding three different behavioral events. For events A and B, patterns of activity across the population are strongly correlated (r: correlation coefficient). For A–C and B–C, activity patterns are orthogonal.

