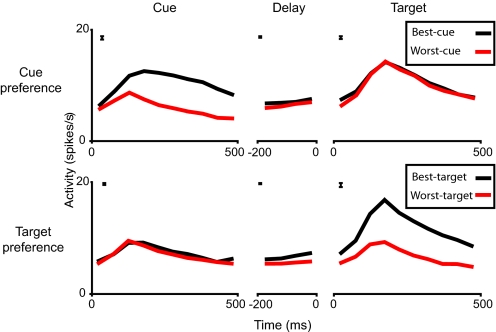
Fig. 5.
Mean activity for cue- and target-selective cells. Upper shows mean activity at each task phase for best-cue and worst-cue trials, across all cases (n = 140, see text) of significant cue preference within one hemifield. Lower shows equivalent data for best-target and worst-target trials, across all cases (n = 191) of significant target preference. For cues and targets, time 0 corresponds to stimulus onset; for delays, time 0 corresponds to onset of the following stimulus. Bar at upper left of each panel shows average standard error of difference of means between best-cue/target and worst-cue/target trials.

