
Figure 6.
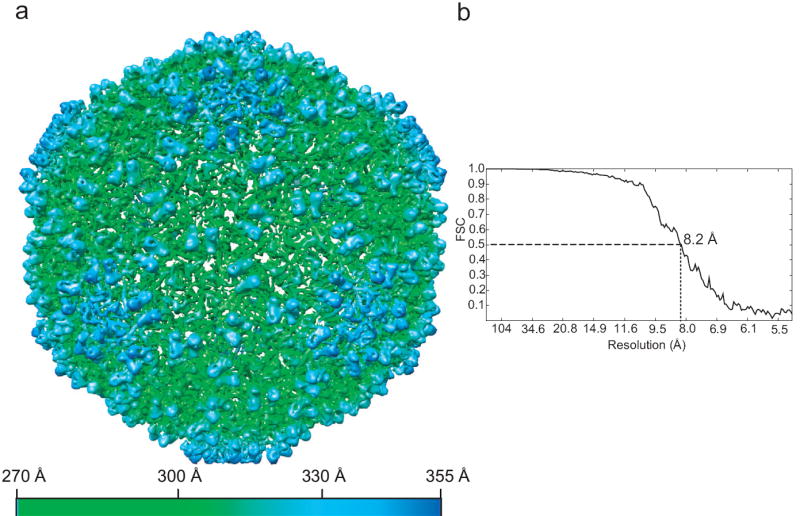
(a) The surface representation of the 3D density map of ε 15 bacteriophage reconstructed from the CCD data. The map is viewed along icosahedral 3-fold symmetry axis, and is radially colored from 270 Å to 355 Å according to the bottom color scheme. In order to display the α helices more clearly, a high isosurface threshold (6.2σ) was used. The inner DNA density was removed in this representation. (b) FSC curve of resolution measurement for the 3D density map. The resolution is 8.2 Å at FSC=0.5.