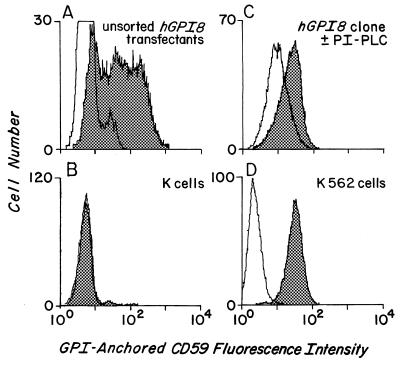
Figure 4.
Stable hGPI8/K cell transfectants. The x axis shows CD59 fluorescence, and the y axis shows cell number. (A) Unsorted Neo-resistant stable transfectants. (B) Nontransfected mutant K cells. (C) Cloned transfectant treated with buffer (shaded) or PI-PLC (unshaded) prior to staining. (D) Wild-type K562 cells. Shaded areas represent staining with anti-CD59 mAb and, except for C, unshaded areas represent staining with nonrelevant RPC5 control mAb.

