
Fig. 2.
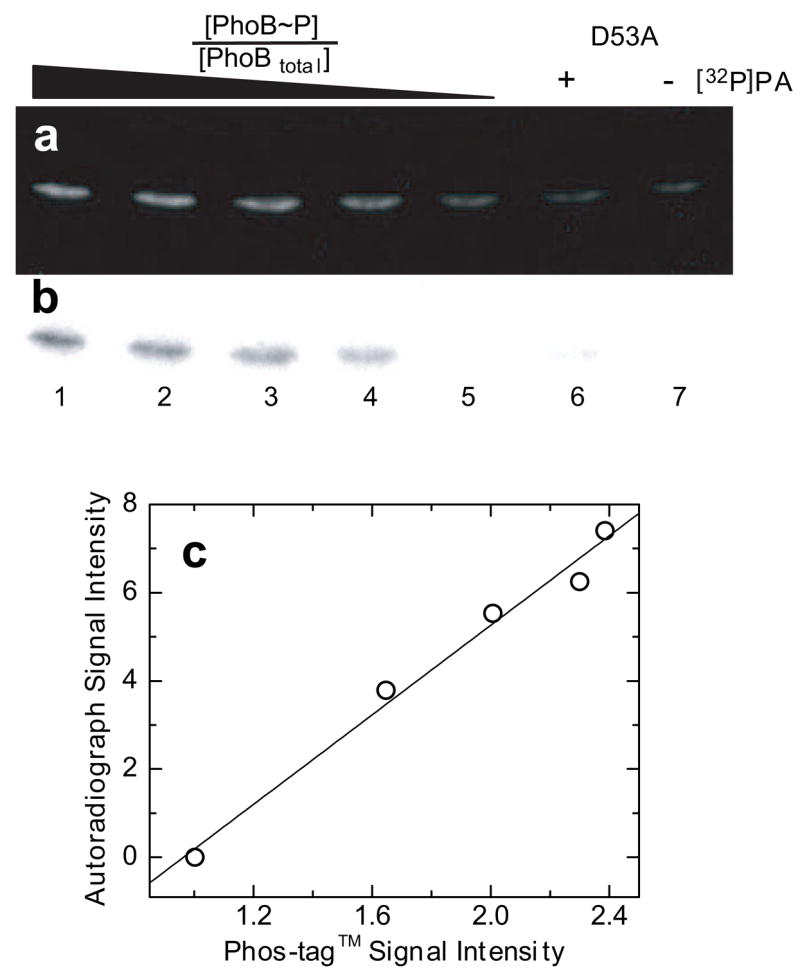
Comparison of Phos-tag™ Phosphoprotein Gel Stain and autoradiography. (a) Phos-tag™ (300/460) stained gel imaged using a uv-transilluminator, uv/vis cut-off filter, and CCD camera with 0.5-s exposure. (b) Image of the same gel obtained using autoradiography. All lanes were loaded with 3.3 μg PhoBtotal. Lanes 1–5 contained known fractions of 1, 0.75, 0.50, 0.25, and 0 [32P]phosphorylated PhoB ([PhoB~P]/[PhoBtotal]), respectively. Lanes 6 and 7 contained 3.3 μg PhoB D53A either following a 1-h treatment with [32P]PA or untreated, respectively. (c) Plot of autoradiograph signal intensity versus Phos-tag™ staining intensity. Solid line represents the linear regression analysis of the data.