
Fig. 3.
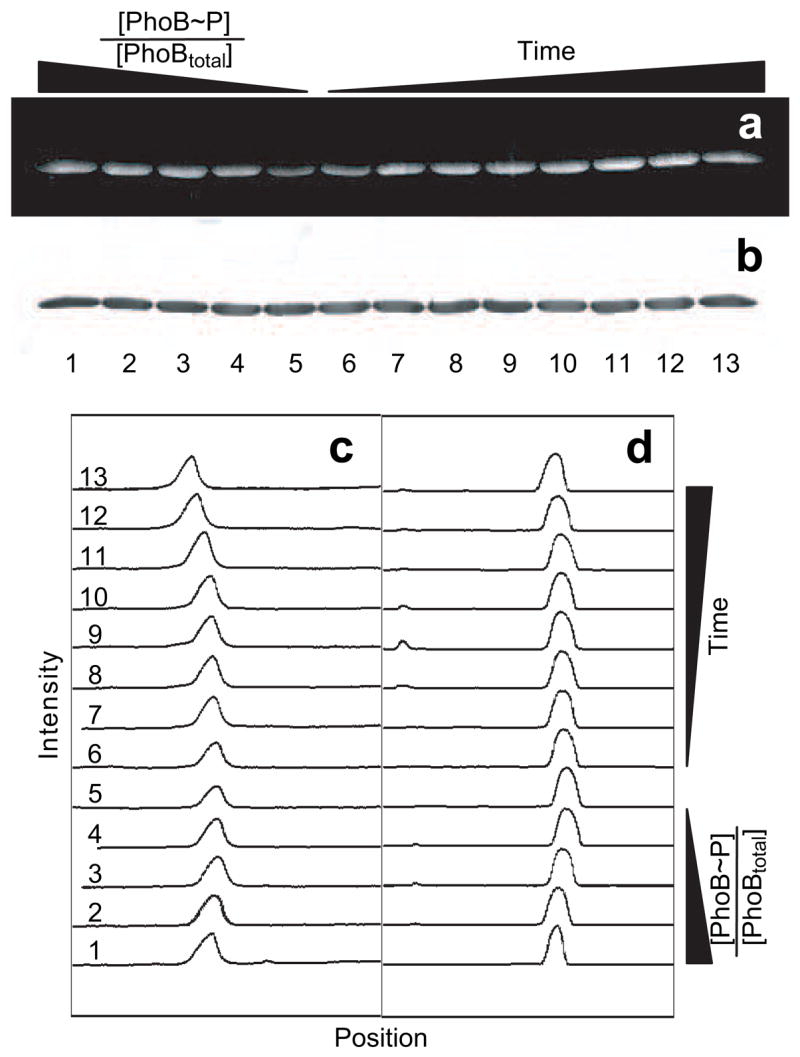
Monitoring of PhoB phosphorylation by phosphoramidate using Phos-tag™ Phosphoprotein Gel Stain. (a) Phos-tag™ (300/460) stained gel imaged using a uv-transilluminator, uv/vis cut-off filter, and CCD camera with 1-s exposure. (b) Image of the same gel stained with Coomassie Blue. All lanes were loaded with 3.3 μg PhoBtotal. Lanes 1–5 contained known fractions of 1, 0.75, 0.50, 0.25, and 0 phosphorylated PhoB ([PhoB~P]/[PhoBtotal]), respectively. Lanes 6–13 contained PhoB either 15, 30, 45, 60, 120, 300, 600, or 1200 s after exposure to 20 mM PA, respectively. (c and d) Plots of band intensity versus vertical position in the lane for the Phos-tag™ stained (c) and the Coomassie Blue stained gel (d). Numbers at the left correspond to lanes of the gel.