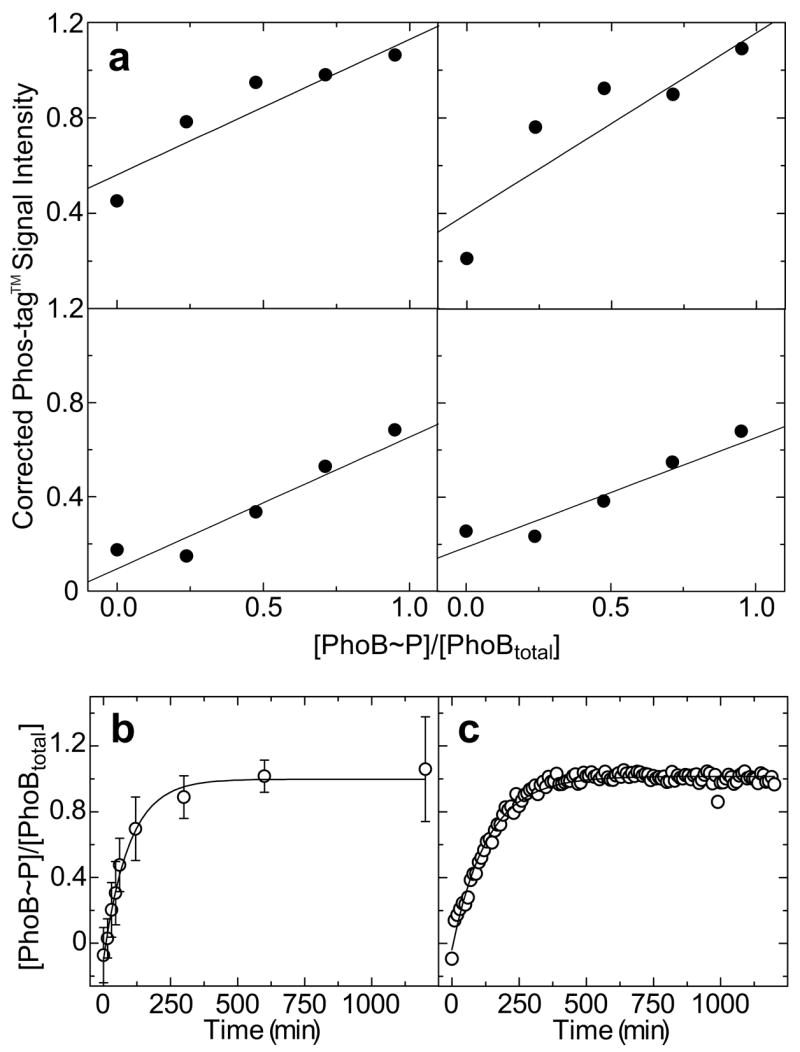
Fig. 4.

Phosphorylation of PhoB by phosphoramidate. (a) Replicate standard curves relating Coomassie-corrected Phos-tag™ signal intensities to known [PhoB~P]/[PhoBtotal] values of standards loaded onto gels in 4 independent experiments. The best fit linear trend line for each set of points is indicated. The upper left panel corresponds to the gel depicted in Fig. 3. (b) Time course of PhoB phosphorylation by PA as measured by Phos-tag™ gel stain. Each point represents the average of 4 measurements of Coomassie-corrected Phos-tag™ signal intensities from 4 independent experiments and correlated to fractional PhoB phosphorylation ([PhoB~P]/[PhoBtotal]) using individual internal standard curves depicted in panel a. Error bars indicate standard deviations from the mean. (c) Time course of PhoB phosphorylation by PA as measured by fluorescence emission intensity at 345 nm. Values of [PhoB~P]/[PhoBtotal] were calculated as described in Materials and methods using the buffer subtracted and dilution corrected fluorescence emission data depicted in Figs. 1a and 1b. The best fit first order exponential decay trend lines for data in panels c and d are shown as solid lines.
