
Fig. 5.
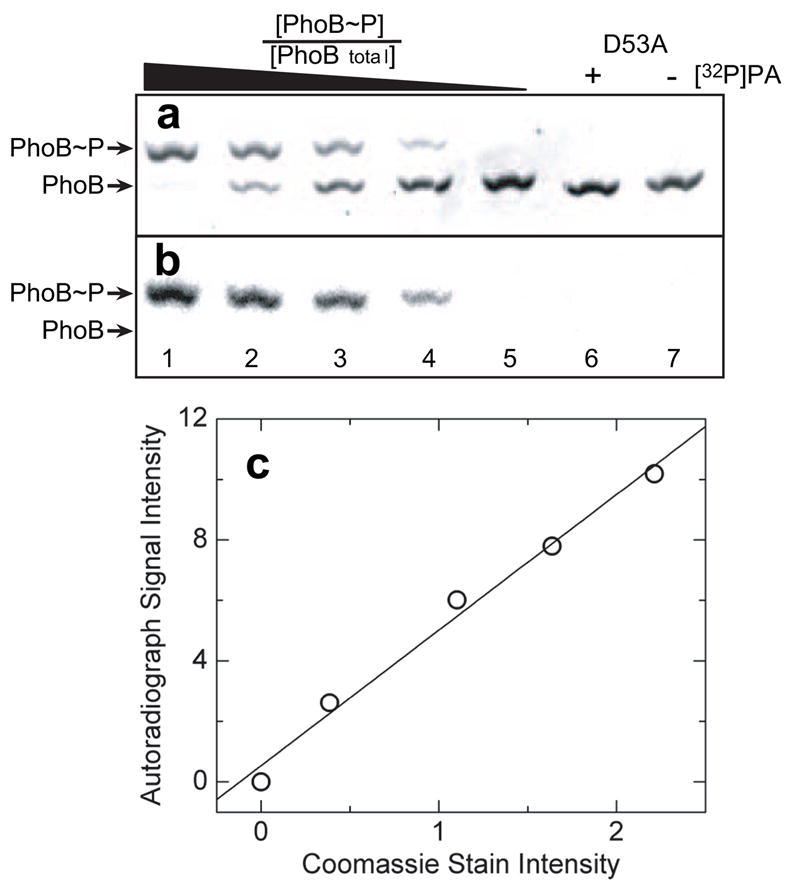
Phos-tag™ acrylamide gel electrophoresis separation of phosphorylated and unphosphorylated PhoB. (a) Coomassie Blue stained image of PhoB standards with known [PhoB~P]/[PhoBtotal] ratios separated on a 75-μM Phos-tag™ acrylamide gel. (b) Image of the same gel by autoradiography using a Phosphorimager. All lanes were loaded with 3.3 μg PhoBtotal. Lanes 1–5 contained known fractions of 1, 0.75, 0.50, 0.25, and 0 [32P]phosphorylated PhoB ([PhoB~P]/[PhoBtotal]), respectively. Lanes 6 and 7 contained 3.3 μg PhoB D53A either following a 1-h treatment with [32P]PA or untreated, respectively. (c) Plot of autoradiograph signal intensity versus Coomassie staining intensity. Solid line represents the linear regression analysis of the data.