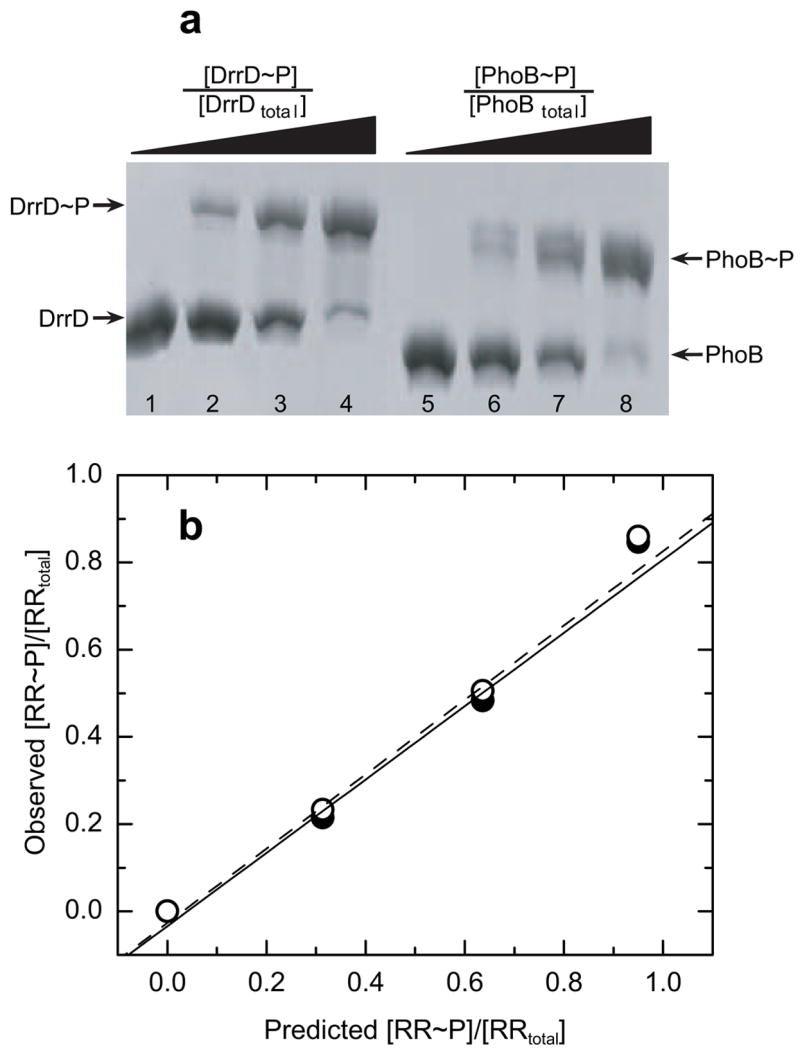
Fig. 6.

Extent of RR phosphorylation monitored using a 75-μM Phos-tag™ acrylamide gel. (a) Analysis of DrrD and PhoB standards with known [RR~P]/[RRtotal] ratios. Each lane contains 3.3 μg of either DrrD (lanes 1–4) or PhoB (lanes 5–8), with known fractions of phosphorylated RR ([RR~P]/[RRtotal]) of 0, 0.33, 0.67, and 1.0, for lanes 1–4 and 5–8, respectively. (b) Plots of the observed fraction [RR~P]/[RRtotal] versus the loaded fraction [RR~P]/[RRtotal] for DrrD (open circles) and PhoB (solid circles). Values were calculated as described in the text. The best fit linear trend line is indicated for DrrD (dashed line) and PhoB (solid line).
